
Once referred to as the agrarian economy, Indian agricultural and allied sector employs the largest proportion of the population, but accounts for the lowest proportion of GDP. Such a disproportionate share of output and employment to the total, implicitly signals low per capita income for farmers. The plight of cultivators is further worsened at times of negative food price inflation which has corresponding repercussions on the political and economic environment.
When the Food Prices hit an all time low!
Food price inflation is desired to remain stable, as either very high or very low levels may have adverse economic implications. The inflation in food products averaged out to 5.71 per cent for the period from 2012 to 2019, having incidences of reaching new highs and hitting record lows. In the November of 2013, the food price inflation hit an all-time high of 14.72 per cent, mainly driven by the vegetable price shock. With the food group having a weight of 47.6 per cent in the new Consumer Price Index calculation, contributed about 56 per cent of inflation in September, 2013, tethering the CPI inflation average for the year 2013 at 9.8 per cent.
The food price inflation, on the contrary, experienced a deflationary phase in the period starting from October of 2018 to the month of February in 2019, hitting a record low of (-)2.65 percent in December, 2018. The Foods and Beverages group holds a weight of 45.9 per cent in Consumer Price Index calculation and has contributed 9.5 per cent to the overall inflation for the period between April, 2018 and February, 2019 as against a 28.9 percent contribution in the last period. The Food price inflation moved into a negative territory in the month of October, 2018 with four food sub groups – vegetables, fruits, pulses and sugar, remaining in the deflationary phase till the end of February, 2019. Prices of vegetables and fruits which account for 13.2 per cent and 6.3 per cent respectively of Foods and Beverages group is the primary driving force behind the spiraling down of Food price inflation. Within the vegetables, the drastic fall in prices of tomatoes and onions had were primarily responsible for the unusual inflation dynamics in among the Food and Beverages group, witnessed during the year. The inflation with respect to onions declined to (-) 57.1 per cent in January 2019, from 40.6 per cent in July, 2018 and the tomatoes remained in a deflationary phase from March, 2018 to January, 2019. Similarly the strong domestic output of mangoes and bananas combined with high imports of fruits (especially apple and citrus) led to a downfall in its prices.
Whom to blame?
Undue fluctuations in food price is always attributed to supply side factors when discussed in the macroeconomic context of the Indian economy. The uncommon plunge in the food price inflation beginning from October of 2018 and extending till February of 2019, has similar supply side factors to blame. India’s food production has been increasing at a rate of 3.6 percent annually and also imported fruits and vegetables, amounting for 134.9 billion Indian rupees for the fiscal year 2018. Strong domestic production of food products accompanied by cheap imports have resulted in excess supply in the market causing a steep decline in food prices.
India adopted Inflation targeting approach in the second half of 2016, and the target for the period from August 5, 2016 to March 31, 2012 has 2 percent as the lower tolerance limit and 6 per cent as the upper tolerance limit. Since the food and the beverages group in CPI calculation accounts for 46 per cent, as in 2016, targeting for a low food price inflation became the easy route in hand for the government to achieve the set inflation target. “According to the study, farmers in India are impacted by a combination of complex domestic market regulations and by import and export trade restrictions, which together often lead to producer prices that are below comparable international market levels” (OECD, 2018). Depressing food prices are also policy induced as the Minimum Support Price set by the government was less than the international prices for several commodities. In addition to low MSP, the trade policy measures such as export prohibitions, export quotas, and export duties discourages the export of food items. Export bans were applied on wheat, non – basmati rice, chick peas, sugar and milk during various time period. The rationale behind such export restrictions is to encourage the local producers to sell their output in domestic markets and to increase the availability of such items in the local market, at a lower price as opposed to higher international prices. Also, the
Government’s effort to manage the supply side includes imposing stockholding restrictions on farm goods and allowing imports at subsidized rate has a similar price depressing effect on agricultural goods. Similarly agricultural incentives involving subsidies for electricity, fertilizers, and irrigation water reduces the cost of cultivation, significantly contributing to a lower producer price. “The report finds that consumers pay on average 25% less on all commodities as the result of policy interventions” and “the overall effect is that policy intervention actually reduces gross farm revenues by over 6% per year” (OECD, 2018).
What does it mean to the economy?
According to Agricultural Census of India, 2011, 61.5 per cent of the Indian population is based on rural economy and hence engaged in agricultural activities. While the agricultural and allied sector account for only 15.4 per cent of the Gross Domestic Product of the country, more than half of the Indian population contribute less than 16 per cent of the GDP of the country. Due to such a structural mismatch in employment and output, the per capita income of the cultivators remains very low in the country. The Situation Assessment Survey (SAS) of Agricultural households (2013), a national level survey conducted by the NSSO, provides useful insights about the farmer’s income from various sources. According to SAS, a farm household received an average annual income of Rs.77112 from both farm and non-farm sources during the year 2012 – 2013. The more recent calculations of per capita income of farmers was carried on by Chand et al (2015) for the period 1983-84 to 2011-12 and the farm income estimates was extended to the years 2015-16 in a policy paper by NITI, authored by Ramesh Chand (2017). According to this paper the per capita real annual income of the cultivator for the year 2015-16 has fallen to Rs.44027, signaling a downward trend in farm income. Such a situation of agrarian distress is further worsened when the market price offered for agricultural commodities decline as it reduces the already low income of the cultivators.
During situations of low food price inflation, the already low farm revenue further declines due to low prices being offered for agricultural products in the market. Lower farm income implies reduced purchasing power of more than half of the population of India which eventually results in depressed rural aggregate demand. Declining aggregate demand impacts the economy in several ways:
A fall in the aggregate demand has a negative impact on the output and prices. Output level and prices fall from its original level due to falling aggregate demand against an undisturbed aggregate supply. A collapse in the output level has undesirable impacts on the Gross Domestic Product of the country resulting in lower national income. Also fall in price level instigates a similar chain of events resulting in vicious spiraling down of prices, leading the economy to a recessionary situation.
Alternatively, diminishing aggregate demand due to reduced rural demand can nullify the efforts made by the government in the form of various planned expenditure, which otherwise would have positively impacted the economy. This not only renders the efforts of government pointless, but also results in futile spending of public money. The fall in the aggregate demand in this case will proportionally less as compared to previous case as the increase in government expenditure reduces the impact to a certain extent.
Looking from the perspective of consumers, low food price inflation reduces their food expenditure without compromising on quantity. According to the survey results of World Bank, an average Indian spends around 51.5 per cent of his income on food items. Therefore a reduction in food expenditure results in a significant increase in disposable income of non – farmers to spend on other commodities. It can be argued that increase in purchasing power of the non – cultivators eventually increase their demand for non – food products thereby leading to an increased aggregate demand. But considering the marginal propensity to consume of rich and poor people, the positive relationship between food price inflation and the GDP growth rate is reiterated. “Around 80 per cent of the poor in India live in rural areas” (World Bank, 2016). This statement implies that people dependent on the farm incomes constitute the largest proportion of the population living below the poverty line and people dependent on non- farm income constitute the largest proportion of higher income group people. With a fall in food prices, the total income lost on the side of the farmers is gained by the consumers. With most of the farmers falling in the lower strata of financial hierarchy, their marginal propensity to consume (MPC) is higher than that of richer sections, who relatively have lower marginal propensity to consume. Hence, the loss in additional consumption of farm-income dependent group is higher than the additional consumption added by non-farm dependent individuals. Therefore the loss in aggregate demand due to falling rural demand is higher than the addition made to aggregate demand through an increase in urban demand, implying a net fall in aggregate demand. Therefore, very low food price inflation does affect the aggregate demand negatively and reduces the output level.
Giving a political dimension to sliding per capita income of the cultivators, also results in political unrest, thereby destabilizing the functioning of government. An unstable or inefficient operation of the government also reduces investor confidence in the economy.
As an empirical evidence, when the quarterly data of GDP growth rate and food price inflation rate for the years 2017 to 2019 were plotted against each other, the resultant graph was upward sloping, reiterating the positive relationship between the two variables.
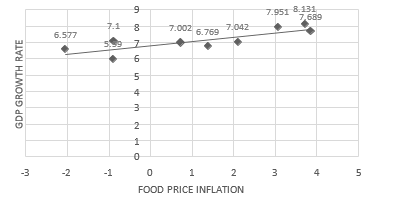
This further substantiates the argument that a low food price inflation, leads to a fall in the per capita income of the cultivators, having a negative impact on the aggregate demand through reduced rural demand. A sudden fall in aggregate demand with no change in aggregate supply results in the fall in output and general price level, instigating a vicious cycle of above mentioned effects.
Sources:
Reserve Bank of India, Ministry of Statistics and Programme Implementation, Central Statistics Office, OECD.

amazing!
LikeLike
Loved how everything was explained in simple language and was understandable for a person who has no information about the topic. Keep up the good work
LikeLiked by 1 person
Nice…..
LikeLike
Informative, Good work
LikeLike
Great Analysis!! Keep it up!
LikeLike
Amazing work. It was really informative 👍🏼
LikeLike
Great work done darshana.. keep it up
LikeLike
Such an informative piece! Great job Darshu❤️
LikeLike
benchmark for dedicated cia’s and research!
LikeLike
Well written…..keep it up
LikeLike
Great work!!..way to go.!
LikeLike
Very Informative and Engaging with the Facts and figures given.
LikeLike
A nice and fabulous effort dharshana👏👏.
Stats were clear and easy to understand.
Nice work and keep it up 🙂
LikeLike
Super Darshu
Nice topic
Good research
LikeLike
Awesome work. Keep it up!!
LikeLike
Very informative. Good job Darshana.
LikeLike
Good work! Deep analysis of topic. Content was explained in simpler terms so as to make more people understand! Tried using all the tools to explain the interpreted views! Kudos
LikeLike
Great job Darshana, that’s so informative and analytical, keep going👏👏
LikeLike
Great choice of topic! Very interesting.
LikeLike
Great Work, Darshana!
LikeLike
A crystal clear artlice!
Awesome Dharshana!
LikeLike